发布时间:2011-07-27 阅读量:1471 来源: 我爱方案网 作者:
中心议题:
*针对96家公司雇员作出分析
2010年的明智决定带来2011年的增长
如果说2009年是“风雨交加”的一年,以雷曼兄弟的2008年秋季破产为起点。2010年就是“阳光初现”的一年,尽管工程师基本上不会觉得日常状况有改善。但是很多公司都对我们2010年在《电子设计雇主50强》中列出七个战略充满信心。
· 在经济形势好的时候聚集力量
· 透明的沟通
· 专注的业务组合
· 正确的削减开支
· 在情况好的时候削减开支
· 增加研发投入
· 投资信息系统
这些公司已经可以收获选择明智计划所带来的成果(表1)。
.jpg)
表1
细看数字
业内失业率曾在2009年10月达到顶峰10.1%,但到2010年年底这个数字已经回落到9.4%,现在只有9.1%。2009年有570万个就业岗位被裁,但2010年至少新增了75.1万个就业岗位。美国的GDP在 2009年减少1.7%,但2010年出现3.8%的增长。这些变化看起来可能不算大,但至少能够说明不利的趋势已经扭转。
2010年,我们所分析的96家公司雇员总数增长1.5%、销售额增长接近10%、税前利润增长83%!尽管统计的样本不太多,但这比2009年的数字有着显著的好转,当时雇员减少5.5%、销售额下滑8.3%、税前利润减少8.9%。
2009年,这些公司成功保住收支平衡,并将负债股权比率(debt-to-equity ratio)的下滑控制在1%以内。2010年,这些公司成功突围,实现利润增长5%、负债股权比率提升9%!这还没完,2009年这些公司的研发投入减少大约4%,2010年则是增加约3% (表2)。
.jpg)
表2
另一个乐观的迹象来自在关键领域出现增长的公司所占比例。2009年,所分析公司中的19%报告销售增长,但只有9%报道利润增长。2010年这两个数字分别跃升为89%和90%。2009年,只有22%的公司报告雇员总数增加、30%报告称研发投入加大。2010年,这两个数字分别跃升为62%和67%(表3)。
.jpg)
表3
更近距离的对比去年和今年的结果显示出有五家公司出现巨大增长。通用汽车排名上窜78位。TRW汽车集团上升64位、泰瑞达(Teradyne)和卡特彼勒(Caterpillar)分别跃升62和61位,Cadence设计系统公司排名也提升56位(表4)。
.jpg)
表4
OEM厂商表现最为强劲的分类是零部件(components and subassemblies),前十强OEM厂商中有六家属于该分类 (表5)。我们的计算方法和2009-2010年没有变化。关于排名计算的完整介绍请看“排名背后的计算方法”。
.jpg)
表5
那么2012年会发生什么?随着人员和资本投资在2011和2012年缓慢回升,这些公司将继续精明地增加产能、加大人员和设计投入,并为市场带来能够真正解决客户需求的高质量产品。同时它们还会严格控制开支、增加效率以抵消商品成本的上升,同时加强能够持续带来销售额和利润回报的产品所占份额。
下一页原文参考:Top 50 Employers In Electronic Design
Smart Moves In 2010 Lead To Growth In 2011
If 2009 was a year for “weathering the storm” symbolized by the fall of Lehman Brothers back in the fall of 2008, then 2010 was a year for taking advantage of “sunnier skies,” though typical engineers may not have felt much improvement in their daily condition. However, many companies stayed faithful to the seven strategies we presented back in our 2010 list of the Top 50 Employers in Electronic Design (see “The Top 50 Employers In Electronic Design”).
? Building strength in good economic times
? Transparent over-communication
? Focused business portfolios
? Cutting the right costs
? Cutting costs during good times
? Increasing R&D
? Investing in information systems
These companies were able to begin reaping the rewards of their intelligent planning (Table 1).
Crunching the numbers
While the unemployment rate peaked at 10.1% in October 2009, by the end of 2010 it came down to 9.4% and is currently at 9.1%. In 2009, we lost 5.7 million jobs, but at least 751,000 jobs were gained in 2010. U.S. GDP decreased 1.7% annually in 2009, but it showed an annual increase of 3.8% in 2010. These improvements may not look substantial, but at a minimum, the negative trends have been reversed.
In 2010, the pool of 96 companies that we analyze collectively showed employee growth of 1.5%, sales growth of almost 10%, and pretax profit growth of 83%! While we are dealing with a low base, this was a significant improvement vis a vis 2009’s employee declines of 5.5%, sales declines of 8.3%, and pretax profit declines of 8.9%.
In 2009, companies did well to hold profit margins flat year over year and prevent debt to equity ratios from worsening more than one point. In 2010, companies knocked it out of the park, improving profit margins by five points and debt to equity ratios by nine points! Last but not least, R&D went from almost a 4% decline in 2009 to almost a 3% increase in 2010 (Table 2).
Another sign of optimism comes from our percentage of companies reporting growth in key categories. In 2009, 19% of our company pool reported increases in sales while only 9% reported increases in profits. In 2010, these percentages have soared to 89% and 90% respectively. In 2009, 22% reported increases in their employee count and 30% reported increased R&D investment. In 2010, again they have soared to 62% and 67% respectively (Table 3).
A closer comparison of this year’s results versus last year’s reveals five companies that showed tremendous growth. General Motors climbed 78 spots, TRW Automotive Holdings rose 64 slots, Teradyne and Caterpillar jumped up 62 and 61 places respectively, and Cadence Design Systems moved up 56 spots (Table 4).
Meanwhile, components and subassemblies represented the strongest category for OEMs, as six of the top 10 OEM companies specialize in this space (Table 5).
Our methodology from 2009 to 2010 did not change, though. For a complete description of how we developed our list, see “The Method Behind Our Mathematics”.
So, what’s on tap for 2012? As employment and capital investment continue to slowly climb back up in 2011 and 2012, those companies that continue to shrewdly expand capacity and invest in their people, design and bring to market quality products that truly address customer needs, and keep a tight rein on costs and stay efficient enough to offset rising commodity costs and improve margins will be the ones that continue to generate solid gains in sales and profits.
随着电子信息产业自主创新能力的持续提升,我国在高端制造、新能源、工业自动化等领域的全球竞争力显著增强。5G、人工智能、物联网等新技术的深度融合,正不断激发国内市场对高端制造、新材料、新能源汽车等方向的旺盛需求。在这一背景下,第106届中国电子展将于2025年11月5日至7日在上海新国际博览中心隆重举办,以“创新强基、智造升级”为主题,全面呈现电子产业前沿成果与关键技术突破,致力打造推动行业高质量发展的核心平台。
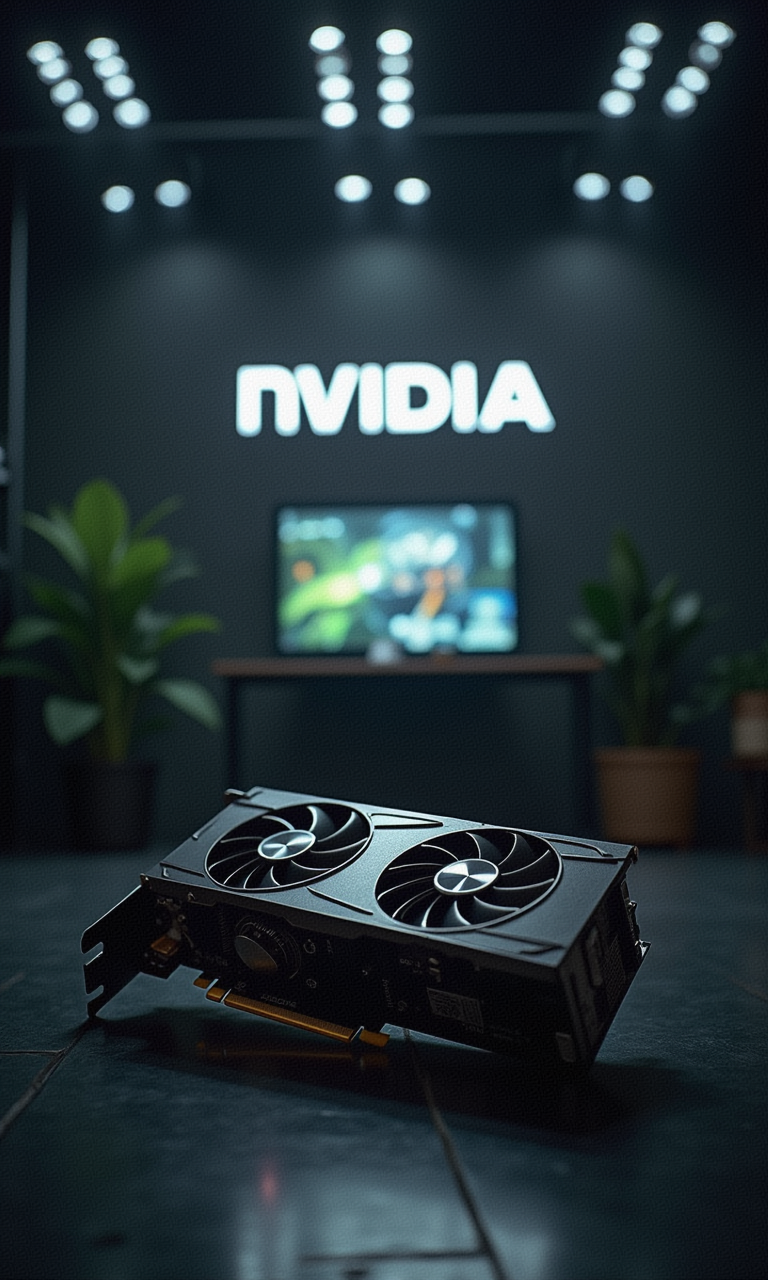
英伟达正式发布代号“Rubin CPX” GPU产品,专为AI领域最棘手的“大规模上下文推理”而生。
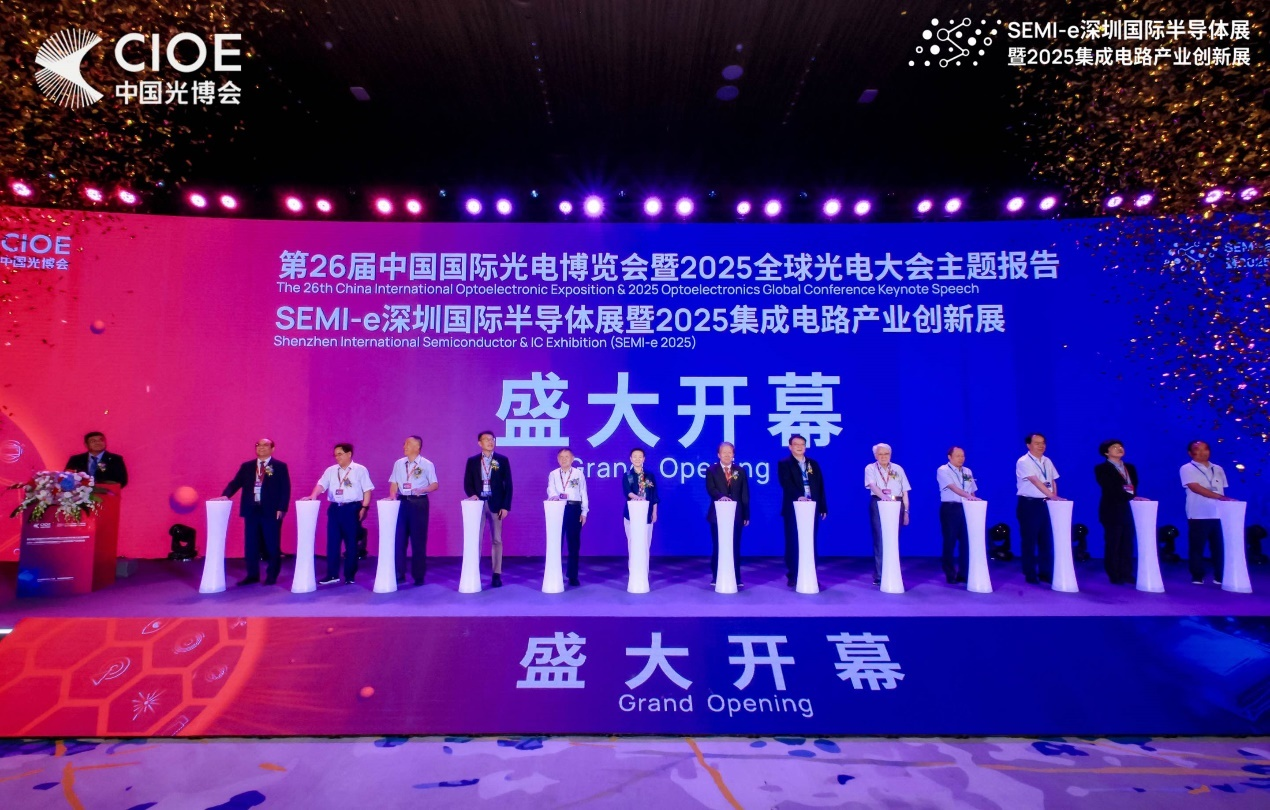
9月10日,SEMI-e深圳国际半导体展暨2025集成电路产业创新展在深圳国际会展中心盛大启幕。本届展会由CIOE中国光博会与集成电路产业技术创新联盟(简称“大联盟”)共同主办,规模与影响力显著提升,汇聚全球半导体行业顶尖企业、专家学者与产业链关键代表,聚焦光电融合、先进制造与跨领域协同,全方位呈现集成电路与光电子技术的最新成果与发展趋势,为产业创新与合作搭建起高规格、高效率的国际性平台。
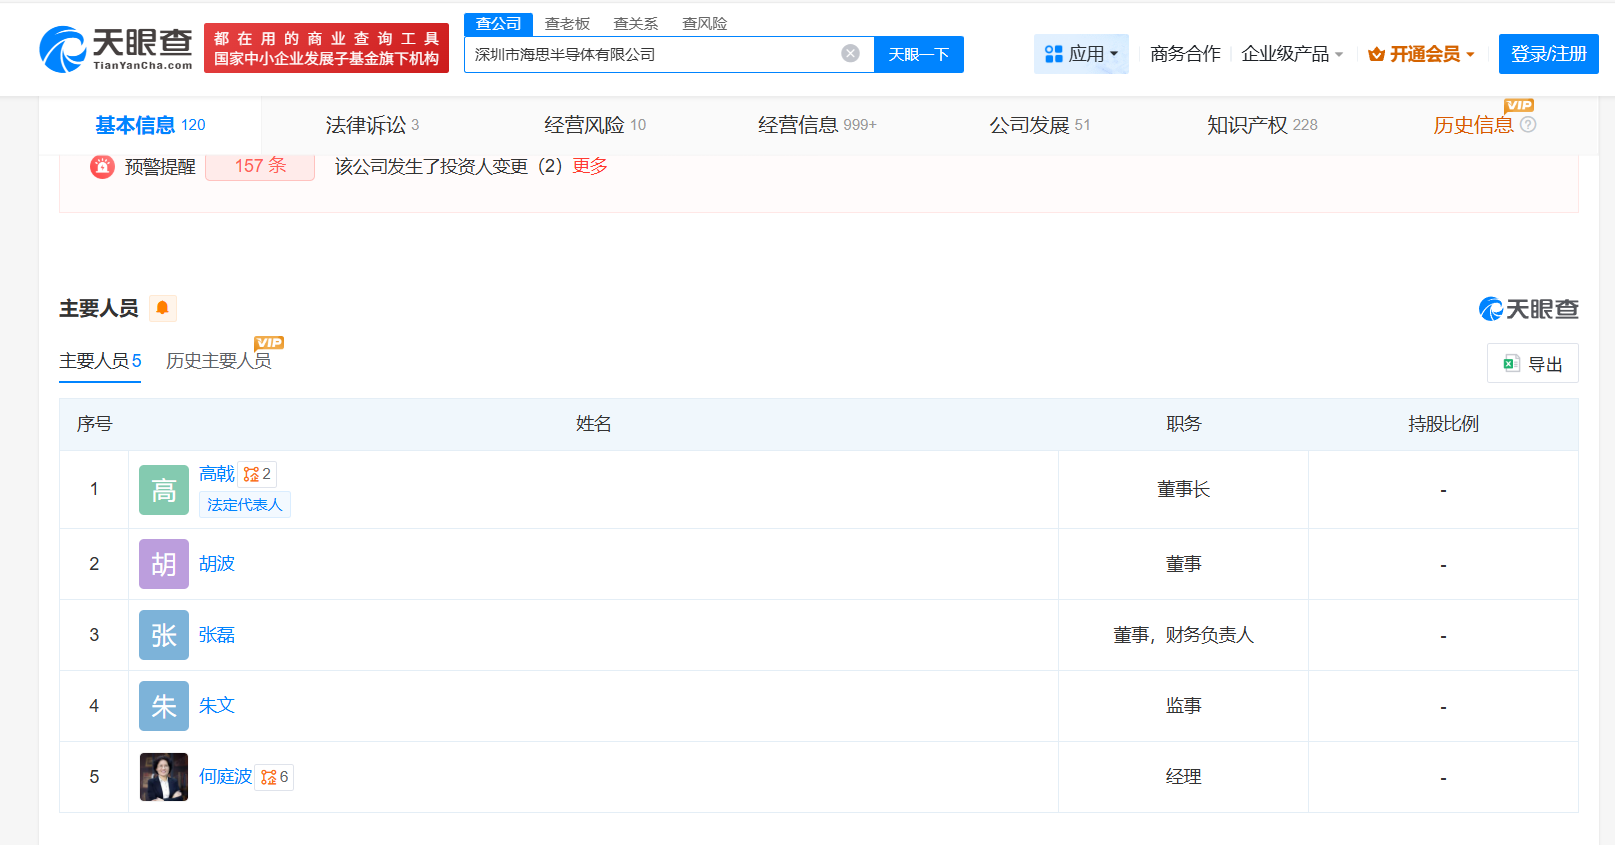
华为旗下核心芯片设计公司深圳市海思半导体有限公司完成重大人事调整,徐直军卸任法定代表人、董事长,由技术背景深厚的高戟接棒,同时完成多位高管的更迭
美国联邦通信委员会(FCC)发布通告:“基于国家安全考量”,FCC即刻实施新规,撤销或拒绝由“外国对手”控制的测试实验室的FCC认证资格


